

EZ Newswire was built to get your news onto publisher sites people actually trust — the outlets readers bookmark, search engines treat as authoritative, and AI systems cite.
But knowing where a release landed was never the same as knowing what it did. The true extent of a press release’s impact has always been an infamous blind spot across the PR industry. Outside of confirming placement, finding out who read it, how it ranked, and most importantly whether and how AI picks it is guesswork.
The numbers back that up. According to EZ Newswire’s 2025 State of the Newswire Report, 98% of marketing and communications decision-makers reported using newswires, but only 20% said they had a favorable view of the return on their investment. The gap between the cost of a release and what impact can actually be shown from it is real — a frustration widely shared by PR practitioners.
Our new reporting dashboard is built to bridge that gap.
In addition to mapping distribution endpoints across publishers, it pulls verified reader engagement metrics, ranking data across all major search engines, and — most importantly — detailed AI visibility metrics that drive real insights on how your news is reflected on all surfaces. You get more than just brand metrics, you see how each individual news release impacts your narrative.
It’s currently live in every EZ Newswire account. To access it, click on any recent release in your account. Here’s what you’ll find:
Open a published release and you’ll land on the Summary page: a snapshot of every key metric from all four reports on one screen, with one-click shortcuts into each — Distribution, Engagement, Search Engines, and Answer Engines.
The Distribution tab shows your total potential audience across every outlet that picked up the release, the number of publishers hosting your content, and live publication status across the full network.
Every placement is listed with its publication date, status, and reach alongside three action icons that sit next to each one: jump to the live release, copy the URL, or share the placement — handy for pushing coverage to your social channels, sales team, or clients without hunting down links manually.
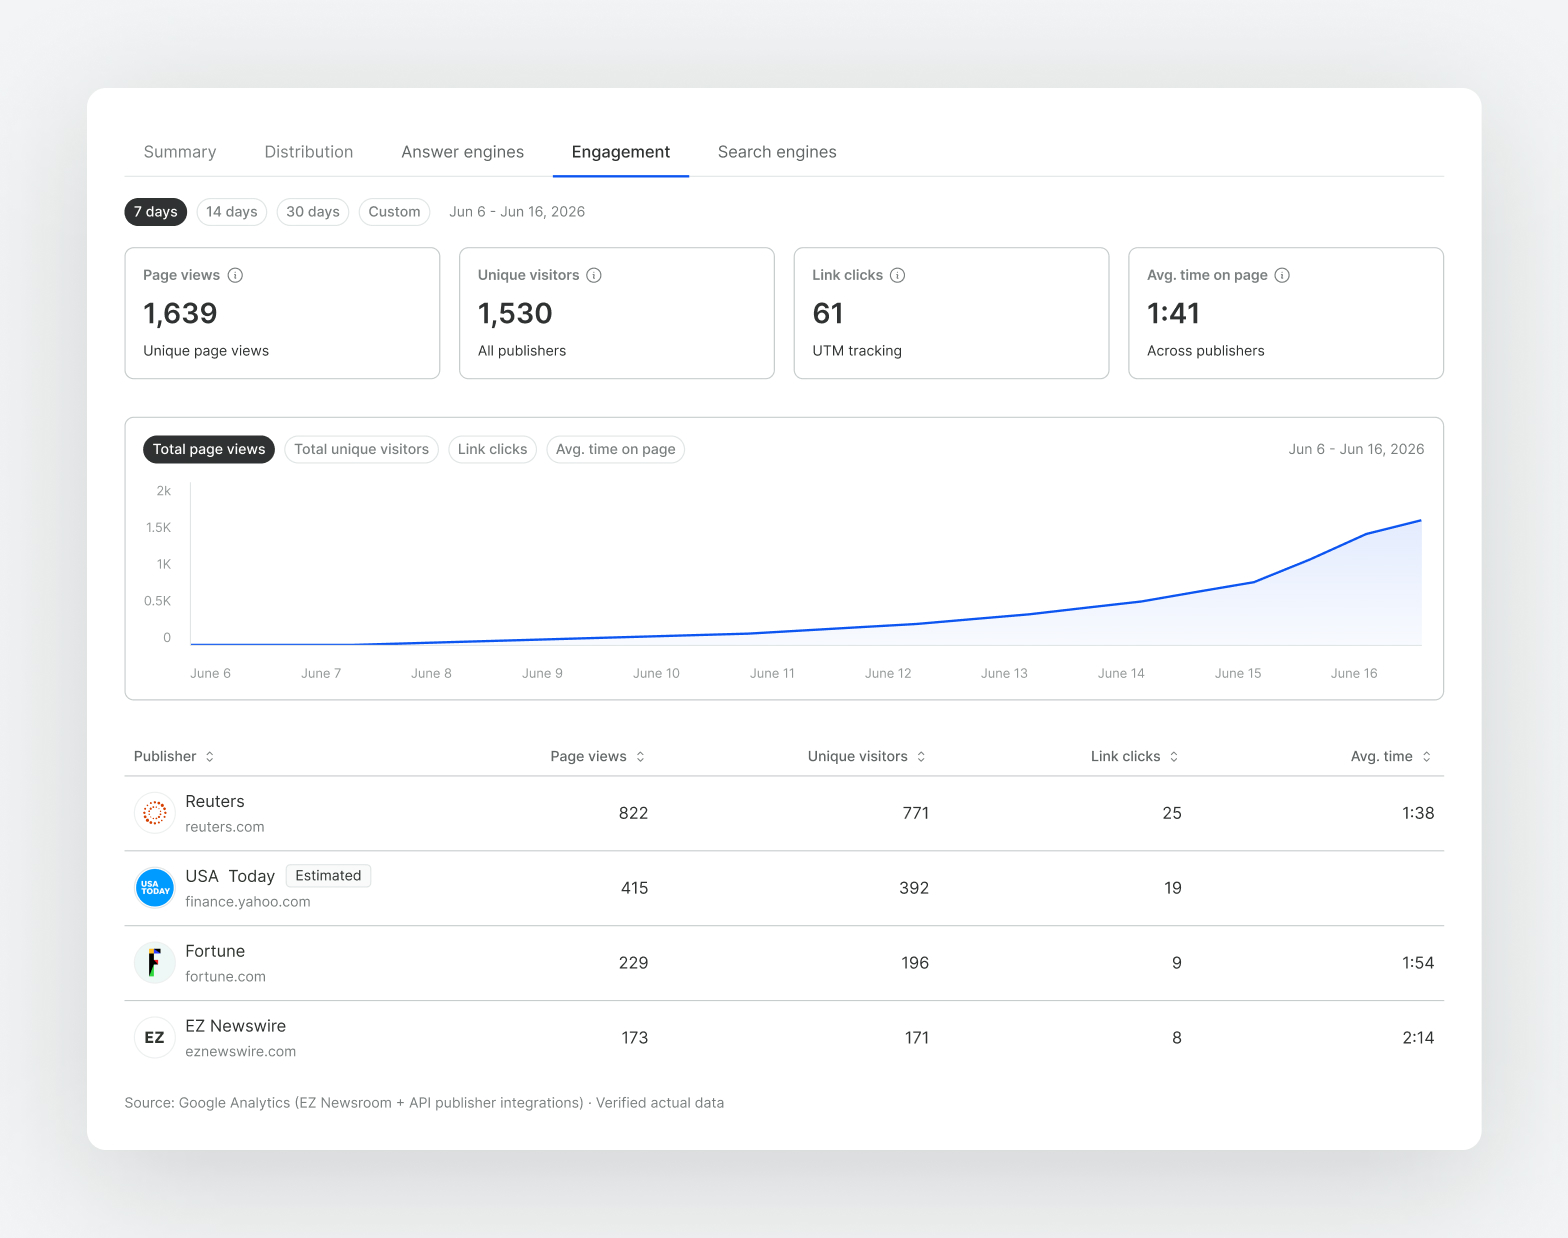
The Engagement tab pulls verified performance data through EZ Newswire’s publisher API integrations — sourced from Google Analytics data from select publishers — and lets you filter across 7-day, 14-day, 30-day, and all-time windows.
You’ll see page views, unique visitors, UTM-tracked link clicks, and average time on page broken down by individual publisher, revealing the outlets that drive the most significant readership. Engagement data is currently live for Reuters and Fortune, with more publishers coming online through the rest of the year as we build integrations.
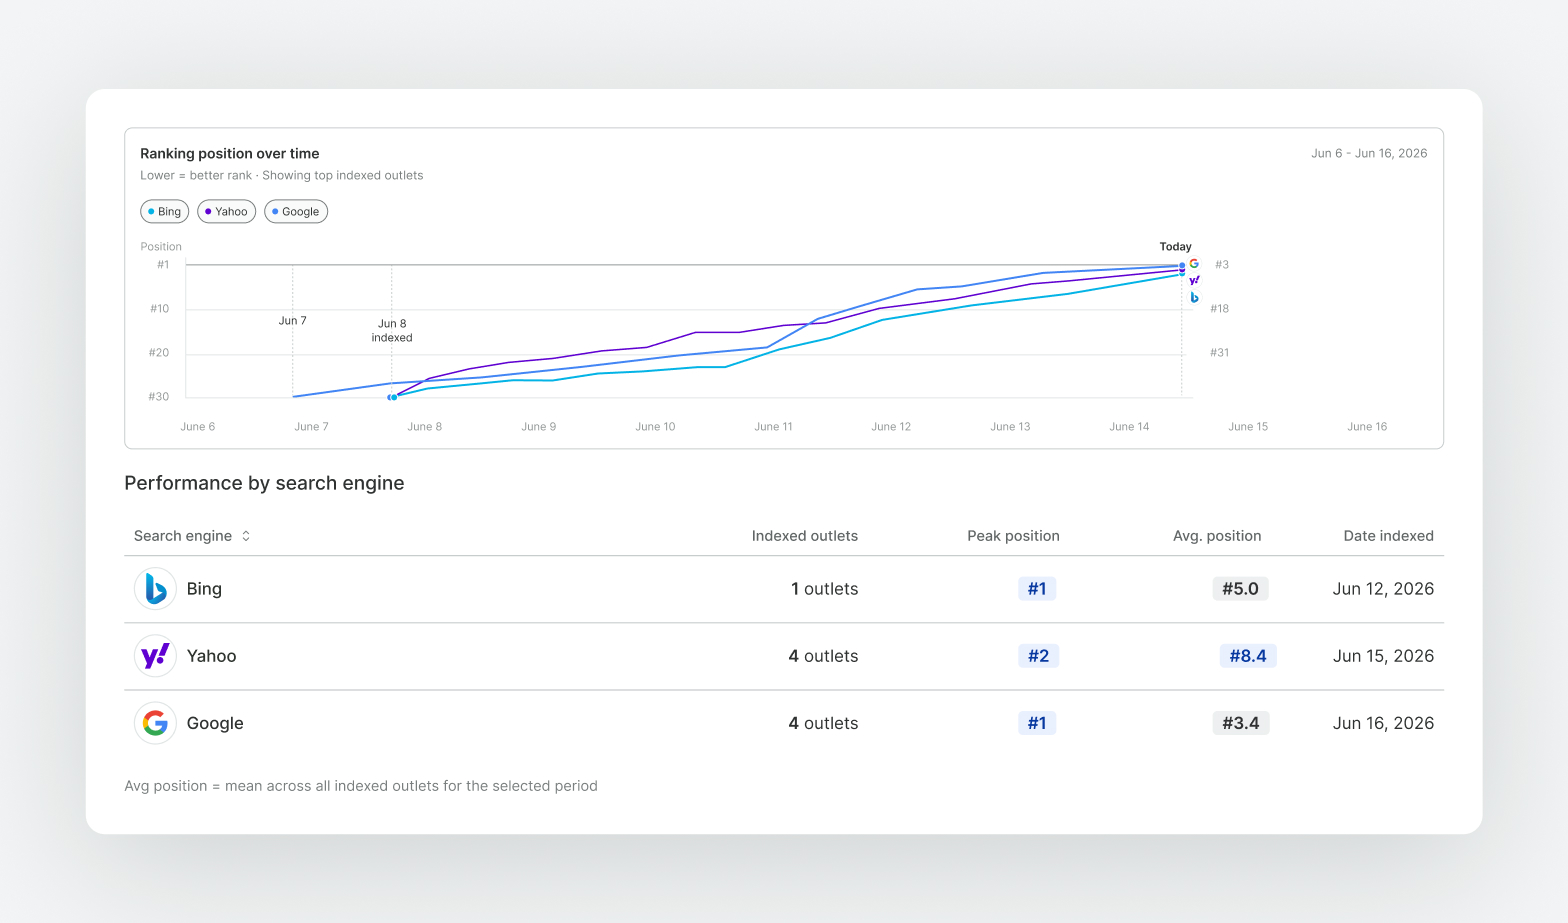
The Search Engines tab tracks how your release performs across major search engines Google, Bing and Yahoo, by tracking relevant keywords and monitoring whether and how quickly each outlet was indexed and your top positions over time.
Three summary metrics: how many outlets have been indexed, the best ranking any outlet has hit, and how fast the first outlet was indexed after you sent the release. Now, you can track and demonstrate the impact your news has on Search.
This report, exclusive to EZ Newswire, surfaces data and insights you won’t find anywhere else: how each of your releases impacts the brand narrative that AI learns about you.
Today, LLMs like ChatGPT, Perplexity, Gemini, Google AI Overviews, Meta AI, and Microsoft Copilot are where consumers, journalists, and buyers go first for information. Whether your brand appears in those responses — and how it’s framed — is a real, measurable variable.
When your news is competing for visibility in a crowded market, this feature is transformative in making sure you get the best impact.
How we do it:
Rather than just tracking your brand’s appearance in LLMs like other PR platforms, we’ve built a granular, data-based approach built specifically for PR.
- Our system takes each press release and breaks down the claims, facts, and brand elements that make up your news.
- We then generate custom prompts that really track how AI is reading, interpreting, and repeating up your news, and we run those prompts against all of the major LLMs, every day.
- We scan those results for brand presence, sentiment analysis, and citations of your brand’s domain as well as each of the URLs your press release has across publishers.
- We summarize and present this data to you as insights across 3 main areas.
What we show:
Release URL Citations
Citations give brands a measurable signal of trust and authority in AI responses. When your brand’s domain or news is cited, it shows that its content is being recognized as a credible source within AI-generated answers, and that the brand’s audience is being exposed to their message. Over time, citation frequency, placement, and context can help measure brand visibility, expertise, and influence in AI-driven discovery.
The Answer Engine report shows how many times your release is cited as sources in AI-generated answers. Click into any prompt and you can read the actual AI-generated answers across every platform, verbatim. The citation list sits underneath each answer so you can confirm whether your URLs are included.
Brand Presence

Presence measures how often your brand appears when users ask AI about the subjects relevant to you. It shows whether the brand is part of the conversation for key topics, categories, and customer questions. Strong presence increases discovery, consideration, and share of voice. Weak presence signals that competitors may be shaping the AI-driven customer journey instead.
This report shows you the % of times your brand was mentioned each time we tracked the prompts related to your brand, industry, and press release.
Sentiment
Sentiment measures whether a brand is described positively, neutrally, or negatively in AI responses. It shows how AI frames the brand’s reputation, strengths, weaknesses, and competitive position. Positive sentiment can reinforce trust and preference. Negative or mixed sentiment can signal reputational risks that may influence customer perception.
Our system reads every AI response we track, and reports on whether the AI spoke about your brand in a positive, negative or mixed way.
It’s live now
The reporting dashboard isn’t just a feature update — it’s a shift in what a newswire should deliver for you.
For brands managing their own communications — startups, small businesses, growth-stage companies — it takes the guesswork out of what your announcement actually did. That doesn’t just validate past decisions; it informs the next ones. Which topics resonate? Which outlets drive real engagement? Which releases build durable search and AI visibility? The dashboard starts answering those questions.
For agencies, the payoff is even more immediate. A single client report spanning distribution reach, verified reader engagement, search ranking trajectories, and AI brand presence is a retention asset and a new-business differentiator in one. It shifts the conversation from “here’s where we placed your story” to “here’s how it performed across every channel that matters.”
The dashboard is live in every EZ Newswire account. It covers every new release going forward, and backfills data for many recent press releases — so most accounts will already have a few months of reports waiting.
Log in, open any previously published release, and see what’s already there.